


How to use Icons as Graphical Indicators with Project for the Web (The New Project)
If you are curious how to use graphical indicators/icons to communicate how a project is tracking with Project for the Web then this video will surely be the one to watch. We cover each step required from saving images, to creating the icons as web resources in the Solution Explorer, modifying and uploading a Javascript file, to create a Project entity field called Overall Health, to accessing the function we created in the All Projects view.
In this video we will explain on how to create “Graphical Indicators” which are used to represent the status of a project, or activities within a project, visually. These Status items are commonly referred to as Key Performance Indicators (KPI). Icons/Graphical indicators are a visual representation of the status of a project or tasks based on specific metrics measured. The metrics measured may vary greatly an could include:
- Variance between Finish Date and Baseline Finish
- Variance between Actual Work and Baseline Work
- Variance Between Actual Cost and Baseline Cost
To take this in a bit more detailed direction, the percentage of the variance as compared to the overall duration of the project or project budget should be taken into consideration. This is because a 7-day variance on a 2 year project is not as critical as a 7-day variance on a 2-month project.
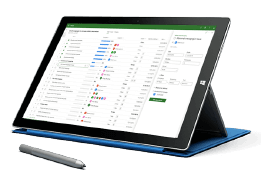
Visual representation of a KPI gives the user a quick overview of all projects in the organization, or if looking at the tasks of a project, all tasks or milestones within a project. This provides management an easy way to focus in on problematic areas and drill into more information.
In many cases, management will not respond well to a report that is primarily based on text and/or numbers, or even a Gantt Chart. What we want to do is make project management a bit less complex for this level of user by providing an easier way to read reports and dashboards, and this is accomplished via stop light reporting of some kind with custom attributes and custom fields. We Based Project, aka The new Project, provides these capabilities for graphical reports. With this and the power apps from the power platform, Power BI, Excel, and more, all types of reports and dashboards as well as system views may be created to satisfy the needs of the business.
Remember, building a project plan, creating summary tasks, summary rows and more using a web based project management system will be a bit different than using Microsoft Project. Actually if you do not currently use the desktop client project online professional, it will seem much easier. Project for the Web will see very heavy investment in the coming months. We will therefore see many more enhancements in it's future.
Project for the Web
Teams must be highly functional in today's collocated environment. Working virtually is an experience that has gone from a novelty, to a necessity. Along the way, software platforms have evolved to enabled a more streamlined experience for today's highly specialized teams.
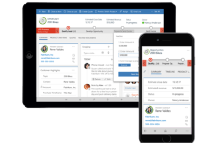
Project for the Web is one of those software platforms intended to help agile teams get work done. The product offers a completely redesigned and intuitive interface. One that is much more intuitive than other project management tools, including MS Project. Creating projects, task planning, tracking and reporting progress are tasks that are simplified in the New Project. And different views for different users, such as the Grid view, board view and timeline provide something meaningful to everyone.
And integrating Project for the Web with Microsoft Teams is simple. Doing so brings the powerful collaboration capabilities of MS Teams together with the New Project to provide an extremely powerful hub for both project and everyday work.
Project for the web (The New Project), formerly known as Project service, is Microsoft's newest offering for cloud-based project management. The product provides simple yet powerful work management capabilities which can be used by project managers and team members to plan and manage all types of work, and of any size.
Project for the web is the latest addition to the Microsoft Project product family, which includes Project Online Desktop Client, Project Online, Project Server, and Project desktop. Project for the web (or simply Project) is built on the Microsoft Power Platform
Everything at your fingertips
The new Project provides access to data via OData. This opens the door to create powerful, interactive dashboards in Power BI, in order to visualize every aspect of each project and resources at a glance. From portfolio views across projects and portfolios for executives to project and resource level for Project and Resource managers, Power BI produces something for every level of user on your Project Team.
Extensible platform
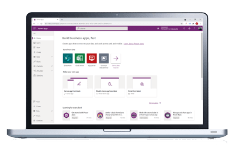
Project for the Web is build on the Microsoft Power Platform. This enables you to quickly connect to many apps and services to create custom desktop and mobile experiences to meet the specific requirements.
Related Links
-
- The Task tab is not showing in Microsoft Project for the Web
- How to Create a Custom Program Entity with Project for the Web
- How to Create a Business Process Flow with Project for the Web
- How to Create a Custom Action Item list with Project for the Web
- How to use Project for the Web custom entities with Power BI
- How to Customize Project for the Web with Entities and more
- What is Project for the Web by Microsoft – A Brief Overview
- Project for the Web Consulting
- Microsoft Project Training
- Microsoft Project Online Consulting
- Microsoft Project Online Migration
- Microsoft Project Online Training
- Dynamics 365 Consulting
- Dynamics 365 Project Operations Consulting
- Microsoft Power Automate Consulting