


Summary
By using reports with Microsoft Project, project managers are able to share data about their project schedule and project portfolios with their teams much easier. Microsoft Project Reports may be customized, formatted and printed in order to get exactly the data and presence you are looking for.
Copies of Gantt Charts, views and timelines may also be exported to images, etc., and used in office programs to again, share data with others on your team or perhaps stakeholders. Project management software such as Office 365 MS Project has many options to display data to various stakeholders and team members such as resource managers, executives, and others.
In this webinar we will demonstrate some of the out of the box reports including the Project Overview dashboard, copying views and reports, and printing views and reports. We will also look at how to save the report in this project management tool for future use. We will have plenty of time for questions and answers therefore come ready to learn and participate.
By the end of this session students will have a solid understanding of how to use reports, views and other items Microsoft Project to share data with stakeholders and others on the project team.
Creating Reports in Microsoft Project Professional
Microsoft Project Professional has pre-installed graphical reports with additional formatting capabilities to make sharing project data with your team easier.
To create a new report in Microsoft Project:
- Click on the Report tab
- In the View Reports group, select the type of report
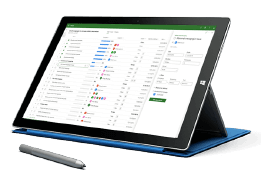
The Project Overview report combines graphs and tables to show where each phase of the project stands, upcoming milestones, and tasks that are past due.
- View the Burndown reports, Report | Dashboards | Burndown
Burndown reports in Microsoft Project Professional are a key part of agile project management, especially Scrum (think board view). They compare planned, completed, and remaining work in a chart. The chart automatically updates as new project data is entered. The default burndown report in MS Project includes two charts: work burndown and task burndown.
The work burndown chart in MS Project shows how we track progress and how much work has been completed, how much is scheduled to be completed by the project finish date, and the baseline estimates of how much work would be completed at this point in the project. If the remaining cumulative work line is the steepest one on the chart, the project may be behind schedule.
Since work burndown charts compare planned, completed, and remaining work they require:
- Resources have been assigned to tasks
- The project has been baselined
To add work fields to track:
- Navigate to a Resource Usage view
- Click on the Format ribbon
- Click on Add Details
- Click on a field from the Available fields area and click Show
- Click OK when finished
The task burndown chart in Microsoft Project shows the number of tasks finished, the number remaining, and the baseline estimate of how many would be finished at this point in the project.
Since task burndown charts compare planned, completed, and remaining tasks you must:
- Baseline the Project.
- Mark tasks complete.
Navigate to a Task Usage View in MS Project and follow the steps above to add fields to track.
Edit Existing Reports
The Project Overview report in MS Project can be edited to display different charts and tables.
- Click on the table you wish to modify
- Change the filter in the Field list
- Modify the table header to reflect the new data
Note: The report was modified to display critical tasks instead of upcoming milestones.
- Click on a chart to change the chart elements, style, or filters
- Use the additional formatting options on the ribbon
To save your changes as a custom report:
- From the Report ribbon click on the Design tab
- Click Manage | Rename Report
- Give your report a new name and click Save
- Click Manage | Organizer to copy the report to your Global mpp
Creating a Dashboard Report in Microsoft Project
Dashboard reports are graphical representations of project data. Dashboards in MS Project combine 4 different reports in to one view. Each of the reports can be edited to change the information displayed. Project Managers can select from the built in templates or create their own custom report.
To view a dashboard report in Microsoft Project:
- From the Report ribbon, select Dashboards
- Select the Project Overview report
- Click on a chart or table
- The field list will appear allowing the Project Manager to change the data presented
- Change the filter in the field list from Milestones Due this month to Critical
- Edit the title and description of the report to match the new data displayed
To save the changes to the report:
- Click on the drop down under Manage and select Rename Report
- Rename the report and click OK
To create a new custom report in Microsoft Project:
- Click on New Report
- Select the type of report
- Name your report
- Click on the chart to view the chart elements
- Click on the text on the Axis to rotate if needed
- The additional formatting option will now be visible
- Change the filter and grouping
- Click Copy Report to paste the report in to another application that supports graphics such as PowerPoint
Creating a Visual Report in Microsoft Project
Visual reports are graphical representations of project data. The reports are created as charts and tables in Excel or Visio. Project Managers can select from the built in templates or create their own templates.
To view a visual report:
- From the Report ribbon, select Visual Reports
Options for creating the report:
- New Template – displays options for the application, data type and the fields to be inserted
- Edit Template – displays the field picker list allowing the user to modify the fields used in the report
- Manage Template – displays the folder where the built in templates are stored, the built-in templates and custom templates are not stored in the same place
- Save Data – provides options to export project data as an OLAP cube
Note: OLAP refers to On Line Analytical Processing. An OLAP cube is a method for storing data in a multidimensional form, generally for reporting purposes.
To create a visual report:
- From the Project ribbon, select Visual Reports
- Select the report you wish to create
- Click View
Printing Project Data in Microsoft Project
Preparing to print project data:
- Change the view to only include what you want to share (hide subtasks or columns)
- Sort tasks or dates to highlight specific information
To print project data:
- Click on File | Print
- Under Settings choose how much of the project you wish to print
- Choose the pages to print, page orientation and paper size
- Click on Page Setup
- Click on the Header, Footer or Legend tab to makes changes
- To remove the legend click on the Legend tab and select None
- Choose whether to print the notes from the View tab
- Click OK to save changes or Print
Saving Project Data in Other Formats
PDF and XPS formats allows you to save a project plan so that others can view the information without having Project installed on their computer.
To save the file in another format:
- Click on File | Save As
- Select the location you would like to save the file to
- In the Save as type drop down change the type to the new format
- Click Save
- Choose the document export options
- Click OK
Note: Once you have saved a plan in a different format, you cannot use Project to make changes to the PDF or XPS document. You must make changes in the original plan and then save the file in the new format again.
Related Links