


Power BI Training: How To Create a Power BI Dashboard with Microsoft Project Online
Download the solution file used in this video
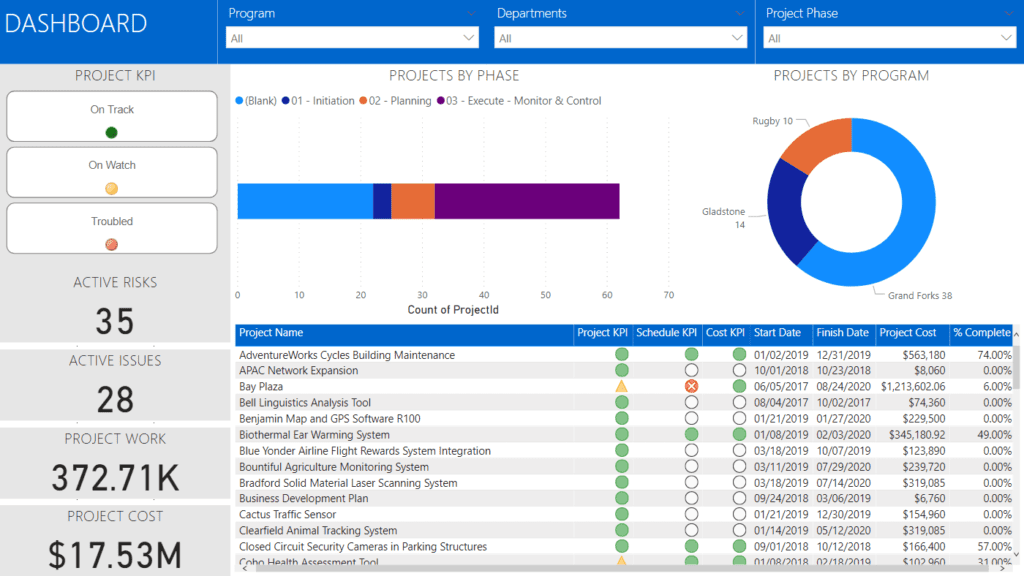
This video is excellent at demonstrating the powerful reporting capabilities of Microsoft Project Online and Power BI when used together. The image below is the dashboard created during this video:
When it comes to developing reports and dashboards with Power BI and Microsoft Project Online, we must first start with a definition of Power BI:
Power BI is a collection of software services, connectors and apps. All these items work in conjunction to turn your data into visually impactful, completely immersive reports. Your data can be from many different sources including Excel, or from many different cloud sources. Power BI is brilliant at a easily connecting these various sources to visualize and share data with anyone.
The parts of Power BI
Power BI consists of several parts
- Power BI Desktop: the Windows desktop application used to create & develop the actual reports and dashboards.
- Power BI Service: An online SaaS (software as a service).
- Mobile Apps: Power BI mobile apps for Windows, iOS and Android devices
Simple and Versatile
Power BI connects very easily to Microsoft Project Online & Microsoft Project Server's project and resource data via OData. Once connected and a data model is created, the reporting tool allows the creation of various types of reports. These include executive summary, portfolio dashboard, and other reports with colorful visualizations and key performance indicators (KPI). Some of these visualizations include key performance indicators (stop lights), donuts, bars, scatter charts, and many others. There are also countless other visuals you can download for free and include on all types of executive reports to analyze metrics.
The Data Model Done Right

Fortunately the Power BI product makes project reporting and report development somewhat intuitive. When connecting to the Project Web App data source, relationships between data sets are automatically created. You therefore not need to know how to construct complex data models. It is good, however, to understand some coding ability as there will be a need to create custom columns on various occasions.
Anatomy of a Report Design
So what's necessary in the designing of a report? Well that depends on the type of report and the audience. Let's take a weekly status report and examine.
In situations where your manager has asked you to manage an important project, one thing is certain. Reporting status on the project is going to be critical. Real-time information is what it's all about, and the report should be something that doesn't require hours to put together.
Your manager will need to keep his superiors updated of your projects tracking.  Effective status reporting means that management is fully informed of a projects overall health. Further, without having to call the project manager directly and ask for information.
Determine What to Include
There will be specific information your organization uses to understand whether or not a project is on time and on budget. You need to provide this information to management in a way that will be easily digested on a regular frequency. The job of a project manager is to create clarify from confusion.

Here are a few major requirements to communication status:
Overall Health
What is the overall health of the project? Management wants to know if the project is on track. Management does not want to have to analyze a project plan or review a Gantt chart. Just about every dashboard will us a certain amount of visualizations to communicate how a project is tracking.
Generally speaking, many organizations will create a Project Health KPI. This KPI would represent the project managers assessment of the overall health of the project. This metric would take into account various elements of the project. These would include scope, cost, time, and net profit margin.
Some organizations, depending on their maturity, may go even deeper. Consider a Cost and Schedule KPI. A baseline is save which determines what we said the project should cost. As we update actual information, we determine variances between baseline and actual metrics.
The calculated variance based on the overall cost or duration of the project would typically equate to a colored indicator. Therefore rather than a single overall health indicator, now management would have indicators that dive into specifics. Here’s how we are doing with regard to cost and schedule.
Milestones
Your project has major accomplishments. These must be completed by specific dates. Understanding the variances on these items is important. A typical Project Status Report will show milestones completed this report period, as well as milestones on tap for the next reporting period.
Risks and Issues
These items are also very important to your project. This is because they may drastically impact your ability to get work done on time and on budget. Recording Risks & Issues and well as their trigger events and resolution is important to project success.
Download the Solution File from this Video
Related
- Project for the Web Consulting
- Microsoft Project Training
- Microsoft Project Online Consulting
- Microsoft PPM Consulting
- Microsoft PPM Training
- Microsoft Project Online Training
- Dynamics 365 Consulting
- Dynamics 365 Project Operations Consulting
- Microsoft Power Automate Consulting
- Microsoft Power BI Consulting
- Microsoft SharePoint Online Consulting