


Table of contents
Opening
The human brain can process images 60,000 times faster than text. With Microsoft Power BI, you can present data in a coherent, visually immersive way.
This means that through Power BI, you can improve your business's efficiency by way of its interactive insights and graphic cues.
The software is constantly developing and improving. At one point, it had 265 new features added in a 12-month period.
It's no surprise that since its release in 2014, Power BI has become a leading business intelligence platform for reports and dashboards, garnering over 5 million subscribers.
Understanding these seven key tips for powerful Microsoft BI Dashboards & Reports will help you keep up with the growing platform and use it effectively.

1. Put Priority Information First
When looking through information, readers tend to go from top to bottom. This means that displaying priority data first is important.
Showing priority information first means that if an end-user leaves early, they will still have read the most important points.
Prioritizing information in this way will therefore increase the spread of data among end-users.
One way to help determine which information should be considered priority is to read Integent's guide on Power BI dashboard creation.
2. Make Use of Tooltips
The tooltip feature allows you to create text pop-ups containing extra information. They are displayed when the cursor hovers over an object.
This means that you're able to create reports in greater detail while keeping them clear.
Tooltips default to the data points value and category. However, they can be customized to provide more contextualized information.
You can learn more about creating contextualized tooltips through Integent's training course.
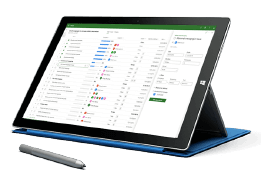
3. Utilize Fullscreen Mode
Did you know that humans have an average attention span of just eight seconds? That means we're easily distracted.
In Microsoft Power BI desktop mode, the fullscreen feature can remedy this.
While in fullscreen mode, you're able to hide all menus and navigation buttons. This allows you to keep reports clear and hold attention to the report.
For an even more focused presentation, Power BI also offers a focus mode. This mode allows specific visuals to be viewed in greater detail.

Much like Tooltips, focus mode offers end users added detail, including a close-up display of table metrics. This grants greater accuracy when analyzing data.
Combining these two modes offers a more in-depth discussion when presenting data to your audience.
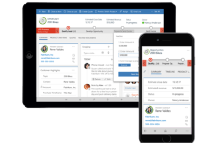
4. Download the Microsoft Power BI App
With the Power BI app, you're able to access dashboards and reports on the go, from any of your mobile devices.
The app is fully touchscreen integrated, which allows you to create fully interactive reports that help to engage readers.
It also features real-time alerts that notify you whenever something important happens with your data.
These push notifications allow you to stay connected, granting you instant access to the status of your information.
5. Correct Integration of Data Warehouses
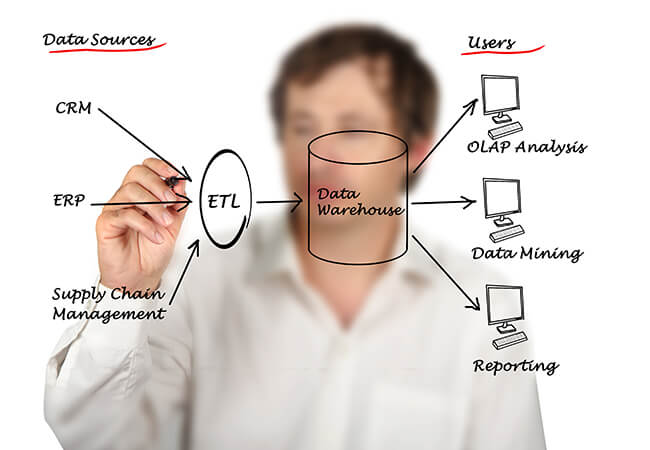
Data warehouses are used to store both historical and real-time data, and Power BI accepts both static and live information.
Microsoft Power BI is built on the utilization of data warehouses such as Excel. As a result, integrating your data correctly is important.
Static data can help to create an overview of your information over a certain period of time. This can be useful for performance analytics.
Live data can be used to present real-time statistics with visuals that automatically change to fit new data sets, effortlessly keeping you up to date.
You can learn more about static and live data integration through Integent's guide to dynamic reports.
6. Clearly Communicate Data
It's important that your Power BI report should convey three key pieces of information: project health, milestones, risks, and issues.
Making this information clearly visible will allow you and your organization to keep track of project progress, success, and areas of improvement easily.
This can be done through contextual visualization, meaning including only data and charts that are entirely relevant to the data set you wish to present. There are many custom visualizations to help you get your point across to your business users.
The best way to do this is to ask a single question and then attempt to answer it using your data without straying from the initial inquiry. Data analytics via data visualizations is the easiest way to communicate tracking information.

7. Ask For Help
The best possible way to create effective Power BI dashboards and reports is to book a consultation with the experts here at Integent. We work with you from the data model through analytics and business intelligence up to mobile apps.
Integent is a leading Power BI service and has been providing business solutions to satisfied clients since 2009, and it boasts a strong team of Microsoft project experts.
We offer training and support specific to Microsoft Power BI, as well as other specialized platforms such as Microsoft Dynamic 365.
Additionally, Integent offers a wide range of free online resources to get you started. They have a variety of Microsoft training videos and articles, all of which can be found on our blog.
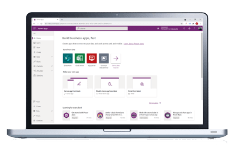
Bonus Tip: Combine Power BI Desktop and Power BI Service
Power BI Desktop allows you to collate, visualize and analyze your data. Power BI service, on the other hand, is a cloud-based platform that allows you to edit and collaborate on data sources as a team across the internet.
Service is typically used as a means to distribute reports, whereas Desktop is used in the actual creation.
Using both services in tandem will allow you to benefit from the whole Power BI suite and work more effectively as a team.
You will be able to create, edit, and distribute data reports in real time, saving time and working together to create accurate reports. And don't forget Power BI mobile for users on-the-go.
Now You're Ready
Now that you've learned the 7 key tips for creating powerful Microsoft Power BI dashboards and reports, you should be ready to present your data effectively.
Power BI is a constantly changing and developing platform, and there's always more to be learned of Microsoft products.
You can learn more about Power BI and become an expert yourself by contacting us at Integent and booking a consultation.