| Step | Action | Details |
| 1 | From the Windows menu, select Start à SharePoint à PerformancePoint Dashboard Designer |  |
| 2 | From the Workspace Browser, select PerformancePoint Content à New à Report |  |
| 3 | Select Analytic Chart à OK |  |
| 4 | Select Tab SharePoint Site à MSP_Portfolio_Analyzer à Finish | 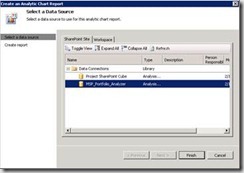 |
| 5 | Your report is being created |  |
| 6 | Rename Report to Forecasted Cost, select Enter. | 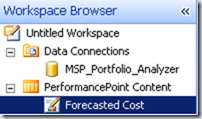 |
| 7 | Expand the Dimensions |
Microsoft Services
Integent has specialized consulting and training services to handle all your project and resource management needs.
VIEW APPLICATIONSMicrosoft Training


Integent offers a comprehensive portfolio of training services, with an ideal fit for every organization. Ranging from general courses to custom solutions, we have you covered.
Learn About TrainingSee Full list of CoursesMicrosoft Consulting


Integent provides consulting services for a variety of Microsoft applications including Microsoft Project, Project Online, Project for the Web, Dynamics 365, and Microsoft SharePoint.
Learn About ConsultingMicrosoft Support


Microsoft technologies set the standard for project portfolio management, business applications, collaboration, and more. Integent has flexible solutions to support every customer.
Learn About SupportMicrosoft Project

Integent has the knowledge and experience to help design and deploy a solution to help your organization manage projects and resources more effectively
Learn More About Microsoft ProjectMicrosoft Dynamics 365

Integent can help you nsure business continuity with a custom cloud solution that connects sales, service, finance, and operations teams to deliver results.
Learn More About Dynamics 365Microsoft SharePoint
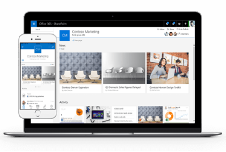

SharePoint is Microsoft’s collaboration platform that is a place where team members can communicate, exchange data, share files and much more.
Learn More About Microsoft SharePointMicrosoft Power Platform
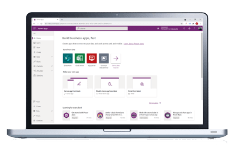

Consisting of Power BI, Power Apps, Power Automate and Power Virtual Agents, the Microsoft Power Platform helps streamline and improve business functions.
Learn More About The Power PlatformAbout Integent
Integent was founded in 2009 on the principles of building long-lasting relationships with customers, exceeding expectations, and providing outstanding customer service.
We’re dedicated to providing a customized solution backed by our knowledgeable team of Microsoft experts.
Discover What Makes Us DifferentWe’re dedicated to providing a customized solution backed by our knowledgeable team of Microsoft experts.

GSA Schedule


Integent is GSA Schedule Contract holder. A GSA schedule helps simplify selling our services to government customers.
Read More HereNews


Stay informed on Integent’s latest company updates and other important industry information. Our passion is customer success.
Read The Latest NewsVideos


Learning new software doesn’t have to be difficult with our library of dozens of free training videos. Our video training always has something new.
Browse Our Training Video LibraryBlog


Our industry experts share best practices and common pitfalls to avoid, in order to get the most out of your technology solutions.
Discover More


