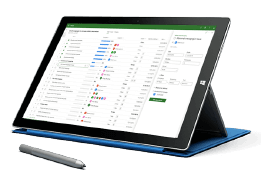
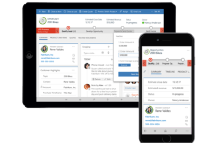
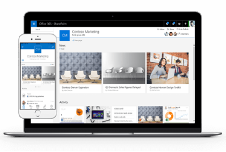
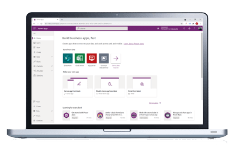
“Managing by Exception” has been the mantra for decades and new reporting tools now allow organizations to surface top variances, critical projects and resources better than ever before. Interactive dashboards and drill-through reports allow executives, resource managers and project managers to better see what is going on in the portfolio. This visibility helps them to quickly navigate down to the details to spot problems and take corrective action.
Enter Reporting with Microsoft Project Online.
Many executives find it hard to know exactly what actions they should be taking. Reporting should guide the audience to any areas of concern and draw attention to changes and where decisions or actions are needed.
Organizations using Microsoft’s Project and Portfolio Management (PPM) solution are replacing the traditional alphabetized lists of projects. They are being replaced by dynamic sub-portfolios that highlight variances and prioritize areas of concern to facilitate data-driven decisions.
Single Source of Truth
In Reporting with Microsoft Project Online, all data and artifacts related to your organization’s projects, programs and resources is stored in a central location. This allows for accurate, up-to-date reporting.
Executives can easily get answers to their most critical questions around the status of active projects and programs as well as alignment to the strategic goals of the organization. Resource Managers can see what their resources are working on and identify any over-allocations or under-utilized teams.
Instead of spending time manually putting status updates together, project managers and team members can focus on project execution, monitoring and control activities. From there, data is pulled automatically from these activities to feed reports and dashboards. Thus, reporting with Microsoft Project Online is robust and thorough.
Reporting Technologies in Reporting with Microsoft Project Online
Reporting with Microsoft Project Online makes a number of reporting technologies available. Each providing unique visualizations and varying levels of customization to help get you started quickly and support growth and maturity.
Excel Online. Excel Online offers the well-known, standard Excel reporting interface within a browser experience. Reports can be authored in Excel and saved to Office 365, allowing viewers to access the data contained within each workbook. Viewers can interact with reports using slicers, timelines, pivot tables and worksheet tabs. Authors can apply conditional formatting to highlight exceptions and use Power View to visualize data in interactive, dashboard-like reports.
Power BI. The Power BI service and companion desktop app (Power BI Desktop) provide brand new and exciting ways of working with and visualizing your. This capability is used for data when reporting with Microsoft Project Online. Power BI can connect natively to a host of data services and also offer secure connections into your enterprise data via the enterprise gateway.
Power BI is a truly extensible reporting platform, allowing report authors to design reports and dashboards using dozens of built-in and add-on visualizations. Once authored, authors then publish these reports to the Power BI portal. Within the portal, the visualizations can be pinned to dashboards which, along with the underlying reports, can be shared with Office 365 groups. Scheduled data refresh keeps administrative overhead low, and all charts and graphs up–to-date.
Office 365 Portfolio Dashboard. The Office 365 Portfolio Dashboard provides a one-stop, end user-friendly interface for surfacing key portfolio insights. Best practice dashboards are driven by project schedule performance metrics, and are built into this reporting solution by default.
The SharePoint integrated app retrieves all standard Project Web App enterprise data right out of the box. Users can create new dashboards, move or add chart components, as well as filter and sort on the data specific to their organization. All the while, the app keeps the data up-to-date in the background without user intervention.
SQL Server Reporting Services (SSRS). For the most robust reporting requirements, report authors consistently turn to SQL Server Reporting Services, or SSRS with reporting with Microsoft Project Online. With advanced reporting capabilities similar to Power BI, SSRS provides full control and customization capabilities to the report author. This allows for data set creation, paginated reports, parallel pivot tables, parameter driven reporting, and drill through reports.
SSRS provides the client authoring tool Report Builder, which allows authors to easily connect to multiple data sources. Once connected, many data sets may be utilized when constructing very detailed and intricate visualizations of the combinations of data. Overall, SSRS provides the stability of the SQL platform, accessibility to many data storage platforms, and unparalleled speed when refreshing your data.
Support multiple Audiences
In Reporting with Microsoft Project Online, report authors can mix and match the above tools in their report development to produce a well-balanced collection of reports. These are reports that tell the compelling stories of project portfolio performance, resource capacity and demand management. Best of all, they are available to your organization in a self-service, easy-to-use format.


