


One thing that can make our rollout of Microsoft Project a success is understanding how our data shows up in reporting and views. This is true whether we’re using Microsoft Project Online or Microsoft Project Server.
At MS Project Now, we’ve seen a wide assortment of client reporting needs. One critical piece is always the timing of the reports.
In both Server and Online, some reporting is, indeed, real-time. Other reporting is based on jobs that run periodically and update tables and cubes.
Remember that real-time is based on the completion of publishing and queue processes, so it can take a few moments.
The list below lays out which types of reports are real-time and which are batched, for both Microsoft Project Online and Microsoft Project Server. For this list, we have focused on the most commonly used tools.
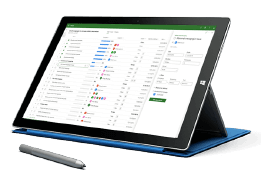
1. Views in Project Center and Resource Center
- Project Server – Real-time
- Project Online – Real-Time
2. Excel Services Reports *
- Project Server – Real-time
- Project Online – Real-Time
* note, Excel Services reports must have data refreshed, either automatically or manually
3. SSRS Reports
- Project Server – Real-time
- Project Online – Batched
4. OLAP Cube Reports
- Project Server – Batched
- Project Online – NA
Understanding how data is processed for our reports is only one piece of the puzzle. Next week, we’ll discuss the human element.
If you have questions about how to best ensure you are using the right tool to get the best MS Project reporting for your needs, please contact MS Project Now.